A renderer that draws a circle at each data point. More...
Classes | |
| class | TreeTooltipGenerator |
| Provides a more informative tooltip string for cell values. More... | |
Public Member Functions | |
| XYTreeRenderer (double fLengthX, double fLengthY, double fXAxisLength, double fYAxisLength) | |
| Constructs a new renderer. More... | |
| void | setScaleFactor (double fScaleFactor) |
| Sets the scale factor, which controls how large trees appear on the screen. More... | |
| double | getScaleFactor () |
| Gets the scale factor, which controls how large trees appear on the screen. More... | |
| void | setMinZ (double fMinZ) |
| Set the value for minimum Z. More... | |
| double | getMinZ () |
| Gets the current value for minimum Z. More... | |
| void | drawItem (java.awt.Graphics2D g2, XYItemRendererState state, java.awt.geom.Rectangle2D dataArea, PlotRenderingInfo info, XYPlot plot, ValueAxis domainAxis, ValueAxis rangeAxis, XYDataset dataset, int series, int item, CrosshairState crosshairState, int pass) |
| Draws the visual representation of a single data item. More... | |
| Object | clone () throws CloneNotSupportedException |
| Returns a clone of the renderer, but not a good one. More... | |
Private Attributes | |
| double | m_fScaleFactor = 1 |
| Controls how large trees appear on the screen. More... | |
| double | m_fMinZ = 0 |
| The minimum Z value to display. More... | |
| double | m_fXAxisLength |
| The X axis length, whether or not the whole plot is being displayed. More... | |
| double | m_fYAxisLength |
| The Y axis length, whether or not the whole plot is being displayed. More... | |
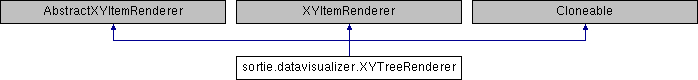
Detailed Description
A renderer that draws a circle at each data point.
The renderer expects the dataset to be an XYZDataset. The XY values are the position of the ellipse; the Z is its diameter, in m.
Original author of XYBubbleRenderer, upon which this is based - David Gilbert
Title: Data Visualizer
Description:
Copyright: Copyright (c) Charles D. Canham 2003
Company: Cary Institute of Ecosystem Studies
- Version
- 1.0
Edit history:
---------------—
April 28, 2004: Submitted in beta version (LEM)
May 9, 2006: Added support for a minimum display DBH (LEM)
February 4, 2008: Updated to conform to Java 6 compliance (LEM)
March 6, 2008: Added a separate argument for plot area, because it was not being calculated correctly when there had been zooming (LEM)
Constructor & Destructor Documentation
◆ XYTreeRenderer()
| sortie.datavisualizer.XYTreeRenderer.XYTreeRenderer | ( | double | fLengthX, |
| double | fLengthY, | ||
| double | fXAxisLength, | ||
| double | fYAxisLength | ||
| ) |
Constructs a new renderer.
- Parameters
-
fLengthX Visible plot length in the X direction. If zoomed, this may not match the whole plot length. fLengthY Visible plot length in the Y direction. If zoomed, this may not match the whole plot length. fXAxisLength Entire plot length, X direction fYAxisLength Entire plot length, Y direction
Member Function Documentation
◆ clone()
| Object sortie.datavisualizer.XYTreeRenderer.clone | ( | ) | throws CloneNotSupportedException |
Returns a clone of the renderer, but not a good one.
- Returns
- A clone.
- Exceptions
-
CloneNotSupportedException if the renderer cannot be cloned.
◆ drawItem()
| void sortie.datavisualizer.XYTreeRenderer.drawItem | ( | java.awt.Graphics2D | g2, |
| XYItemRendererState | state, | ||
| java.awt.geom.Rectangle2D | dataArea, | ||
| PlotRenderingInfo | info, | ||
| XYPlot | plot, | ||
| ValueAxis | domainAxis, | ||
| ValueAxis | rangeAxis, | ||
| XYDataset | dataset, | ||
| int | series, | ||
| int | item, | ||
| CrosshairState | crosshairState, | ||
| int | pass | ||
| ) |
Draws the visual representation of a single data item.
- Parameters
-
g2 - the graphics device. state - the renderer state. dataArea - the area within which the data is being rendered. info - collects drawing info. plot - the plot (can be used to obtain standard color information etc). domainAxis - the domain axis. rangeAxis - the range axis. dataset - the dataset. series - the series index (zero-based). item - the item index (zero-based). crosshairState - crosshair information for the plot (null permitted). pass - the pass index.
◆ getMinZ()
| double sortie.datavisualizer.XYTreeRenderer.getMinZ | ( | ) |
Gets the current value for minimum Z.
- Returns
- The minimum Z.
◆ getScaleFactor()
| double sortie.datavisualizer.XYTreeRenderer.getScaleFactor | ( | ) |
Gets the scale factor, which controls how large trees appear on the screen.
- Returns
- Scale factor.
◆ setMinZ()
| void sortie.datavisualizer.XYTreeRenderer.setMinZ | ( | double | fMinZ | ) |
Set the value for minimum Z.
- Parameters
-
fMinZ Value for minimum Z.
◆ setScaleFactor()
| void sortie.datavisualizer.XYTreeRenderer.setScaleFactor | ( | double | fScaleFactor | ) |
Sets the scale factor, which controls how large trees appear on the screen.
- Parameters
-
fScaleFactor Scale factor.
Member Data Documentation
◆ m_fMinZ
|
private |
The minimum Z value to display.
◆ m_fScaleFactor
|
private |
Controls how large trees appear on the screen.
◆ m_fXAxisLength
|
private |
The X axis length, whether or not the whole plot is being displayed.
This allows the renderer to scale the size of the tree circles.
◆ m_fYAxisLength
|
private |
The Y axis length, whether or not the whole plot is being displayed.
This allows the renderer to scale the size of the tree circles.
The documentation for this class was generated from the following file: