SORTIE-ND
Software for spatially-explicit simulation of forest dynamics |
|||||||||||||||||||||||||
PlotThe plot in SORTIE is the simulation of the physical space in which the model runs. It has a size, a climate, and a geographical location. Plot sizeYou can think of the plot as a rectangle (although it's not really - more on that later). You tell the plot what its east-west and north-south dimensions are. It's useful to keep your plot size in mind when you are setting up your parameters and viewing your output, since many SORTIE values are per hectare units. The size of your plot also makes a difference in run time - the larger the plot, the longer the run. The absolute minimum size of a plot is 100 meters by 100 meters; 200 meters by 200 meters is a more realistic minimum. It is a careful balance to find a plot size big enough to see the effects you are interested in but not so big that your runs take too long to be practical. Since the length of the run depends on many other factors in addition to plot size, you may need to tweak plot size a bit until you've found a good value. The SORTIE Coordinate SystemSORTIE uses X-Y coordinates, starting at (0, 0), which is at the southwest corner of the plot. Positive Y coordinates increase to the north; positive X coordinates increase to the east. There are no negative plot location values. The coordinate values are in meters. 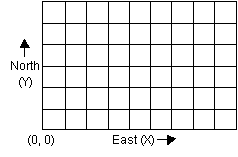 Plot shape: the torus forestWhen you are working with the plot, you think of it as a rectangle. In fact, it is a torus (donut). Each edge connects to the edge on the opposite side. To picture this, imagine a sheet of paper. Roll the sheet of paper into a tube, then bend the tube around so its ends meet. This is what the SORTIE forest looks like. The purpose of this shape is to eliminate edges in the forest. Trees near the "edges" of the plot torus "see" trees on the far "edge" as being right next to them. The torus shape is what controls the minimum plot size in SORTIE. Some processes in SORTIE require searching a portion of the plot - for instance, to find all the trees in a given circle. If that search took place over too great an area compared to the size of the plot, it would run the risk of searching "around the world." It would work its way around the torus and back to (and past) the place it started, finding the same trees multiple times. Plot climate and locationThe plot also has a climate and a geographical location. Some behaviors use this information but others do not. This information is ignored if it is not needed. Plot parameters
|
|||||||||||||||||||||||||
|
FAQ - Contact Us
|
|||||||||||||||||||||||||